Global Economic Analysis Infographics
SNL simplifies complex financial data and analysis with a range of infographics across the business sectors we cover. These data visualizations summarize markets and identify current trends in the banking, insurance, real estate, energy, media & communications, and metals & mining industries. Click on the images below to take a closer look at our insights on global economic analysis.
Africa Mining by the Numbers
Despite the year-on-year decline in global exploration budgets in 2015, Africa continued to be an important exploration destination. With an exploration budget of US$1.20 billion, the region accounted for 13.5% of the world's total exploration budget in 2015.


Latin America Mining 2015
Latin America continues to be a big player in the mining industry, comprising countries that are
some of the largest contributors of iron ore, copper and gold. In this infographic, SNL Metals & Mining highlights key
mining activity in the region including drilling activity, commodity revenues, reserves and resources in-situ values,
capital raisings and exploration budgets.

Map of natural gas generation by state - April 2015
Recent data from the U.S. Energy Information Administration detailed a historic shift in electric generation fuel source in the United States in April. However a state-level analysis tells a different story with many states still heavily dependent on coal to fire power generators while still many other states barely use coal or even natural gas to satisfy their electric needs.

EPA's required CO2 emission rate reductions vs. projected levels
The much-anticipated final version of the U.S. EPA's Clean Power Plan shows that some states will have a long, hard road to meeting the regulation's 2030 carbon emissions goal, while others should be able to coast into the finish line.

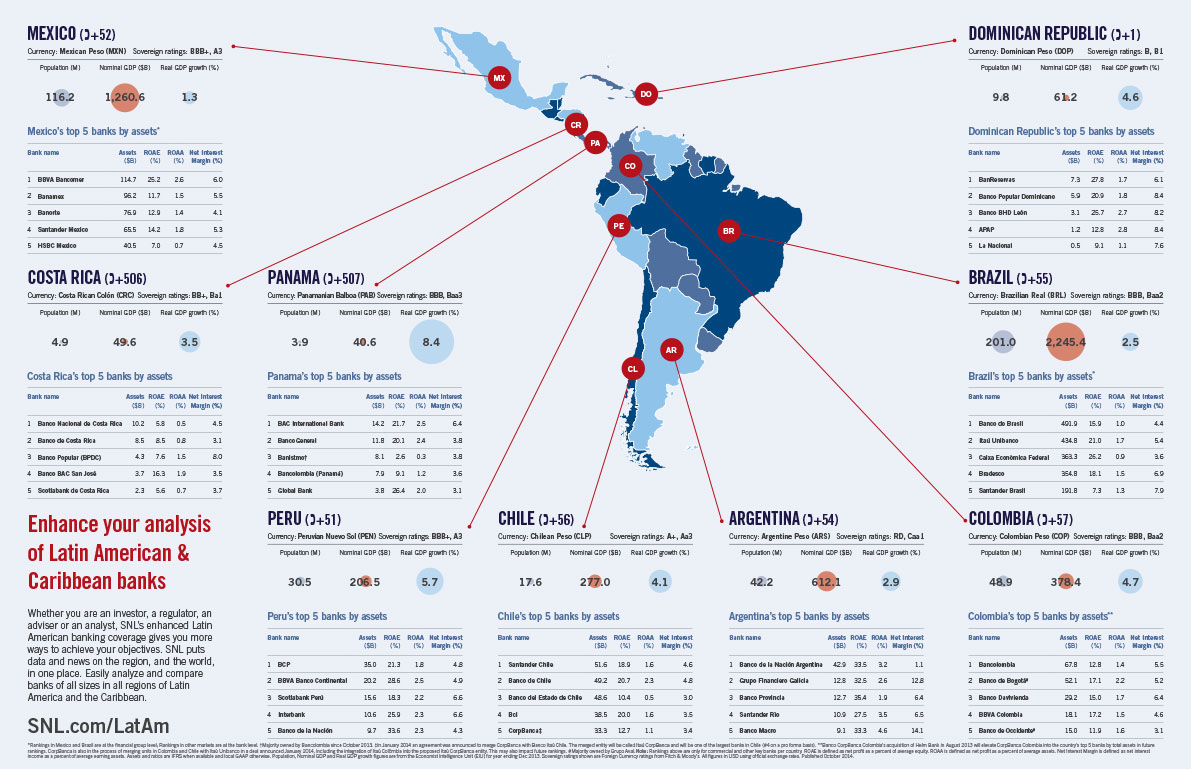
The largest banks in Latin America and the Caribbean
This infographic map shows the largest banks by assets, GDP, population and sovereign ratings per country in Latin America and the Caribbean region. Quickly compare banks in Central America -- including Costa Rica, Mexico, Panama and the Dominican Republic -- to banks in South America, including Argentina, Brazil, Columbia and Peru.

Top 20 Lloyd’s syndicates by GWP
SNL data shows that among the top 10 Lloyd's syndicates by gross written premium, QBE Insurance Group Ltd.'s largest individual syndicate underwent the most dramatic swing. Premium at Lloyd's Syndicate - 2999 dropped by 20.62% year over year, leading it to slip two notches to eighth place in our ranking of the largest syndicates in 2014.

Primary export markets for Indonesian coal
Indonesia, the world's leading thermal coal exporter, has reduced coal production since the start of 2015, a move that can cut shipments to key coal markets such as India. Still, U.S. coal exporters may have to slug it out with other international players to make inroads into new Asian markets, industry analysts and sources say.

Mobile banking app survey results
To compare the breadth of service offered by the 36 largest banks' apps, SNL looked at the features available on each banking app and found that Capital One Financial Corp. offers the highest number of features, with 13, narrowly outranking 10 banks that tied for runner-up with 12 features apiece. The features that set the high-ranking banks apart typically pertained to personal finance, the ability to quickly look at balances, or cash back/rewards programs.

Largest U.S. coal producers by market cap
Review the operating metrics and first-quarter 2015 earnings estimates for the nation's largest coal producers by market cap. Companies on the list include: Consol Energy, Alliance Resource Partners, Foresight Energy, Peabody Energy and more.

Domestic branch networks of select Asia-Pacific banks
A look at the number of branches per million people run by the three largest banks in each of five select Southeast Asian countries, in comparison to their peers in the developed market of Japan, indicates that there is room for lenders in the region to significantly cut costs by adopting new online business models allowing them to downsize their branch networks. The figure for Southeast Asian banks ranges from 6.5 to 18.3, based on SNL data current as of Jan. 21, compared to 4.7 for Japan's Mitsubishi UFJ Financial Group Inc., which has the most extensive branch network in Japan among the country's top three banks by assets.

Europe sees short-term growth in coal demand
Seaborne coal demand in Europe increased in 2014 and is expected to continue its growth in 2015 as regulatory changes work in its favor. Europe is still a huge market for coal, with its thermal coal and lignite demand standing at 353 million tonnes of coal-equivalent in 2013. However, emission controls rolled out by the European Union have started impacting the overall coal usage in the region with the expectation that demand will sink to 339 million tonnes in 2019. Germany is Europe's largest coal importing nation, but exporters may set their sights on Turkey, which has been backing the growth of coal-based electricity generation.

Oil shock extends its reach to BDCs, fintech
Crude oil's slump has had ramifications extending well beyond the price at the pump. The domino effect looks likely to hit financial institutions in oil-heavy regions of the U.S. and the investment portfolios of a number of big insurers. An analysis conducted by SNL also found a number of U.S. financial technology and specialty finance companies moving either in trajectories similar to the one the commodity has taken since the summer of 2014 or in ones diametrically opposed to it.

Midstream MLPs' market cap surges in midst of shale build-out
The surging level of market capitalization among midstream master limited partnerships — with some individual MLPs showing dramatic increases — reflects the momentum of North American natural gas infrastructure development and the asset class creating that infrastructure. As of Nov. 2014, cumulative values for the 15 largest midstream MLPs had increased by almost 81% compared to third-quarter end values in 2012. Total market value of common equity for the 15 largest MLPs increased by almost $153.12 billion to $343.21 billion as of Nov. 2014 compared to $190.10 billion about two years ago.

The history of net neutrality
As more high-profile TV networks consider going over-the-top (OTT), the prospect of a growing number of consumers watching their programming online raises some important questions for the net neutrality debate currently raging Washington, D.C. As more networks consider OTT offerings, many are contenders for subsidizing a "fast lane" to prioritize their traffic for customers using the networks of various ISPs. SNL Kagan summarizes the history of the net neutrality debate with this new infographic.

Cooling degree days vs. EPS estimates by state
The maps below highlight the four U.S. regions most negatively impacted by Cooling Degree Day changes in Q3 2014. Typically, third-quarter earnings make up the greatest contribution to power companies' annual performance. CDD changes are depicted by state, along with service territory by holding company. The graphic also includes FactSet mean EPS change from third quarter 2013 to third quarter 2014.

Campaign contributions by financial institutions to the 2014 U.S. midterm elections
The 16 largest U.S. banks and financial firms donated more than $16 million in campaign contributions to candidates in the 2014 midterm election cycle, and many companies favored Republicans more than in previous cycles. For this infographic, SNL examined two groups: the six largest financial firms, or the Big Six, and a group of 10 banks with at least 750 branches or offices and more than $50 billion in total assets, deemed the superregional banks. SNL also reviewed donations from the Independent Community Bankers of America and the Credit Union National Association.

Turner cable TV network economics
On October 21, 2014, DISH Network Corp. customers temporarily lost access to seven Turner networks in an affiliate fee dispute: CNN, Cartoon Network, truTV,TCM, HLN, CNN en Español and Boomerang. The chart below shows the economics for these seven networks, including average subscribers and affiliate revenue per average subscriber by month.

Top 50 European insurance groups
From gross premiums written to operating profit, SNL Financial's infographic provides a simple overview of key financial metrics of the largest 50 European insurance groups. Our standardized formats make it easy to compare insurers in Spain, to those in the UK, France or Germany.

The largest real estate companies in the Asia-Pacific
This detailed map includes population, real GDP, real GDP growth and sovereign rankings for 8 of Asia-Pacific's countries, and also provides important statistics for their top 5 property companies including market capitalization and dividend yield.

U.S. power generation density
This map provides a basic density analysis of power plant output in the continental United States relative to overall capacity. Get a "hot spot" view of the types of power generation exclusive of other fuel types, and identify broad geographic trends. The power plants of each respective fuel type are considered and weighted by their operating capacity.

Europe's largest banks by assets
From population to sovereign ratings, SNL Financial's European bank infographic provides a detailed map identifying the largest banks in 13 different European countries, key country-level statistics, as well as other important facts from the individual regions. Easily compare banks in Spain to banks in France, Germany or Denmark.

Pennsylvania's Marcellus Shale, in 4 maps
Nearly 7,700 unconventional natural gas wells have been drilled in Pennsylvania since development began in the Marcellus Shale a decade ago. Mapping each of the wells drilled shows that producers are largely focused on the northeast, dry-gas core of the play, centered on Susquehanna and Bradford counties, and the southwest, rich-gas core of the play, centered on Washington and Greene counties.

Europe's largest property companies
Examine the top 5 real estate companies by market capitalization for 11 different European countries in this well-organized infographic, which also includes the one-year total returns, dividend yield, leverage and property focus for each company on the list.

Top six banks in India
Profit at the six largest Indian banks —State Bank of India, ICICI Bank Ltd., Bank of Baroda, Punjab National Bank, Bank of India and HDFC Bank Ltd. — declined year over year in the fiscal year ended March 31, 2014. Aggregate net profit attributable to the parent companies fell 3% to 455.63 billion Indian rupees from 469.68 billion rupees a year earlier.

Wisconsin Energy/Integrys pro forma company overview
Wisconsin Energy Corp. and Integrys Energy Group Inc. on June 23, 2014 entered into a definitive agreement under which Wisconsin Energy will acquire Integrys in a transaction valued at $9.1 billion. Upon completion of the deal, the combined company will be named WEC Energy Group Inc. The combined entity is projected to have a regulated rate base of $16.8 billion in 2015, serve more than 4.3 million total natural gas and electric customers across Wisconsin, Illinois, Michigan and Minnesota, and operate nearly 71,000 miles of electric distribution lines and more than 44,000 miles of gas transmission and distribution lines.

Breaking down media conglomerate revenues
SNL Kagan breaks down the segment results of six major media conglomerates for the first three months of 2014, with year-over-year comparisons. The infographic below shows the results for Walt Disney Co., Time Warner Inc., 21st Century Fox Inc., CBS Corp., Viacom Inc. and Comcast Corp.'s NBCUniversal Media LLC.

European loan-to-deposit ratios show wholesale funding dependency
In this latest infographic analysis of full-year 2012 and 2013 as well as first-quarter 2014 data, SNL Financial calculated loan-to-deposit ratios at a batch of large European banks on the basis of total loans to customers and total deposits from customers. From a total of 50 banks analyzed, 14 are shown below.

US natural gas distribution main and service line infrastructure
The total length of distribution mains and service lines in the U.S. increased almost 200,000 miles between 2004 and 2013, and local distribution companies are increasingly relying on plastic to move natural gas throughout their systems. Corrosion remained the largest cause of repaired leaks in 2004 and 2013, with almost 29% and 26% of the total repaired leaks, respectively. Repaired leaks caused by equipment saw the largest percentage point increase, to 21% in 2013 from 5% in 2004.

Asia-Pacific's largest banks
This infographic map provides an instant overview of key banking statistics in the Asia-Pacific region. Compare banks in China to banks in Hong Kong, Singapore or Australia and see the largest banks by assets, GDP, population and sovereign ratings for each country.

Performance of sector-focused fund managers
SNL's experts analyze filings from select financial sector-focused investment managers each quarter to gain insight into changes in portfolio allocation and portfolio performance. Better understanding the changing investment strategies at significant players in the market, combined with SNL's news, data and analysis, allows SNL clients to refine their own investment strategies and give them an edge in finding opportunities in the financial institutions space.

Pay TV subscribers in Western Europe
This infographic provides a complete picture of multichannel markets in Western Europe, detailing Pay TV and broadband subscriber statistics for 16 countries across the region, plus video service ARPU and affordability metrics.

Where in the world is U.S. coal going?
The United States exported nearly 425 million tonnes of coal between 2010 and April 2014, more than half of which was shipped to customers in Europe. Approximately 60% of all coal exported from the U.S. during the period was metallurgical quality coal bound for international steel manufacturers. The busiest U.S. port during the analyzed period was Norfolk, Va., followed by New Orleans, Baltimore and Mobile, Ala.

AIA + Citi = Asia covered
Asian insurer AIA Group sealed a multi-billion dollar deal with Citi in December 2013 to distribute its insurance policies across the region. AIA now has exclusive rights to distribute insurance products via its bank branch network in 11 Asia-Pacific markets to Citi's corporate clients as well as to about 13 million retail cardholders. This infographic shows how Citi's bancassurance network will enhance AIA's ability to reach Asia's rapidly expanding middle class.
