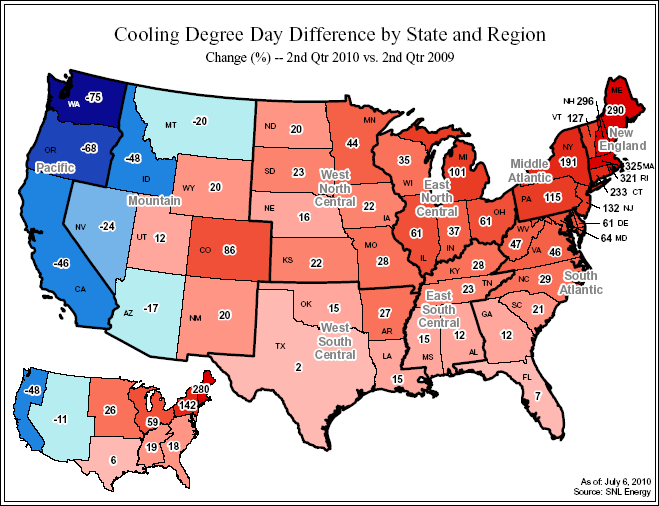
In a recent research report, RRA, an affiliate of SNL Financial, pointed out that hot early summer weather in most regions of the U.S. produced 20% greater cooling degree days in the second quarter of 2010 compared with the 2009 second quarter, and 30% more CDDs than normal. For electric utilities, the second quarter is usually the third-most important in terms of profit contribution. (The third quarter is No. 1, the first quarter No. 2 and the fourth quarter No. 4.) Under normal weather conditions, the second quarter is the second-most important in terms of CDDs (28% of the annual norm) and the third-most important in terms of heating degree days (12% of the annual norm). Heating kilowatt-hour sales are less important to the industry than cooling sales, particularly in the second quarter. Accordingly, much of the data and discussion in this report will focus on CDDs. That said, we note that HDDs during the second quarter were 15% below the second quarter of 2009 and 20% below the norm for the quarter. (See Table 4 under "Sources" for details.)
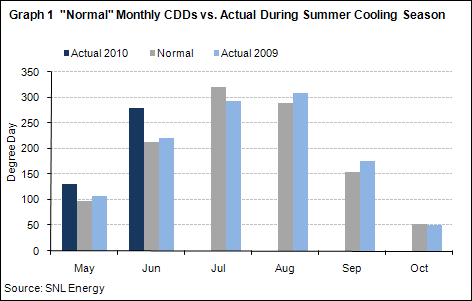
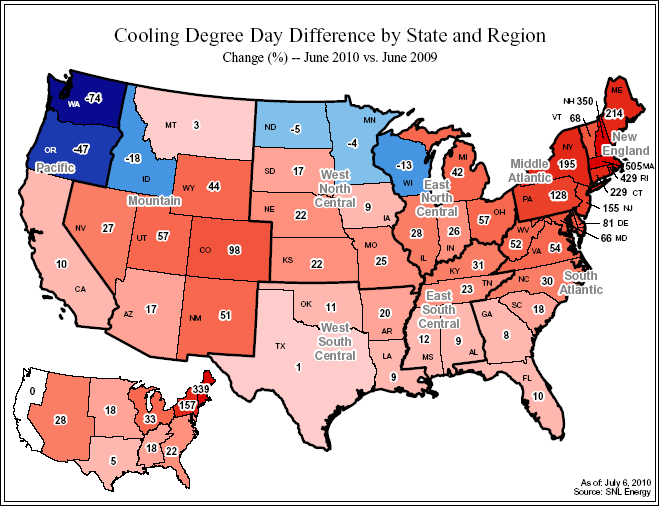
The graph below displays the relative importance of CDDs on a nationwide basis, month-by-month, relative to the overall summer cooling season (from both actual and normal perspectives). While the spring typically is not a crucial month in terms of air-conditioning sales, the extreme warm weather during May and June will make a significant contribution to second-quarter profits, which will be released in the third week of July. We note that some percentage changes shown in Table 2 and the attached map appear extremely high due to the relatively small number of CDDs that serve as a base in calculations. For example, in the attached Table 2, Massachusetts had a 505% change last month, a year-over-year CDD increase from only 22 to 133.

Regarding second-quarter sales, much can be gleaned from a close analysis of Table 3 and the attached "quarterly" map. Companies in the New England, mid-Atlantic and east-north-central regions are likely to report stronger sales during the second quarter due to the early summer heat. Conversely, weather was milder in the Pacific region (and to a lesser extent the mountain region); companies in those regions may report more sluggish weather-related sales results versus the second quarter of 2009. Results for June, shown in Table 2 and the "monthly" map show somewhat similar CDD trends as those for the second quarter.
Regarding the remainder of the summer cooling season, sales comparisons with last year could benefit from continued hot weather. We note that nationwide CDDs in July 2009 suggested mild temperatures, at 8% below normal (see Graph 1 above), while in August 2009, temperatures increased, as CDDs increased 7% on average nationally.
A CDD is created for each degree that the mean daily temperature exceeds 65, and a heating degree day similarly reflects below-65 temperatures. Data included in this report are based on population-weighted data collected by the National Oceanic and Atmospheric Administration.


