“We made huge progress on our growth strategy in 2013, and, as a result, Mosaic is positioned to emerge, in a stronger business environment, as the world’s leading crop nutrition company.”
Jim Prokopanko President and CEO
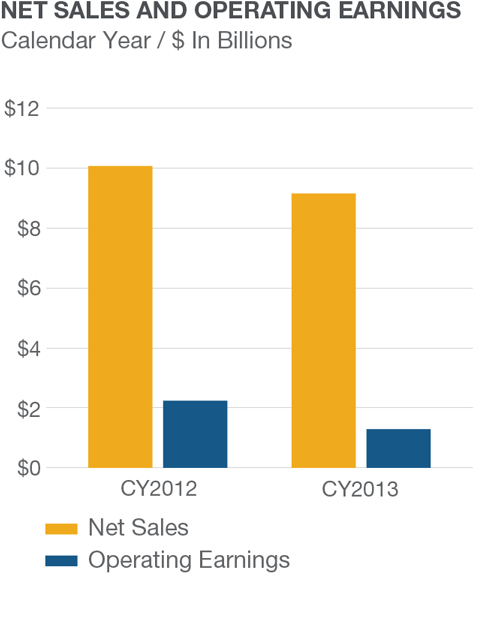
Two-year Financial Overview
- Calendar Year In Millions (except per share amounts)
- CY2012
- CY2013
- Net Sales
- $10,044.0
- $9,021.4
- Gross Margin
- 2,729.7
- 2,015.4
- Operating Earnings
- 2,203.4
- 1,339.9
- Net Earnings
- 1,852.1
- 1,062.9
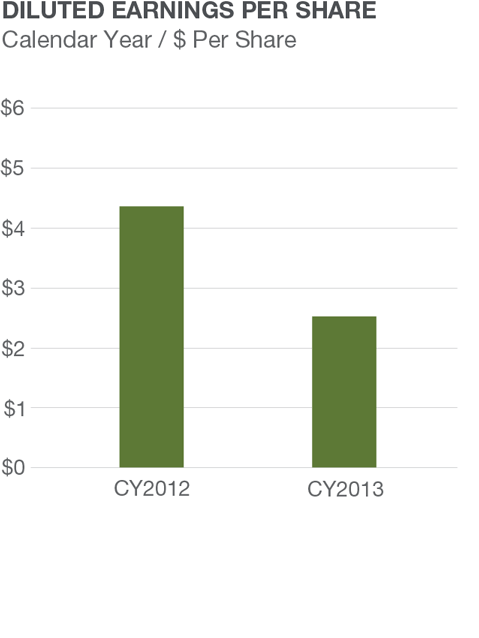
- Diluted Net Earnings Per Share
- 4.34
- 2.49
- Cash and Cash Equivalents
- 3,405.3
- 5,293.1
- Total Assets
- 17,438.4
- 19,554.0
- Total Long-term Debt
- 1,010.6
- 3,009.3
- Total Equity
- 13,083.2
- 11,320.6
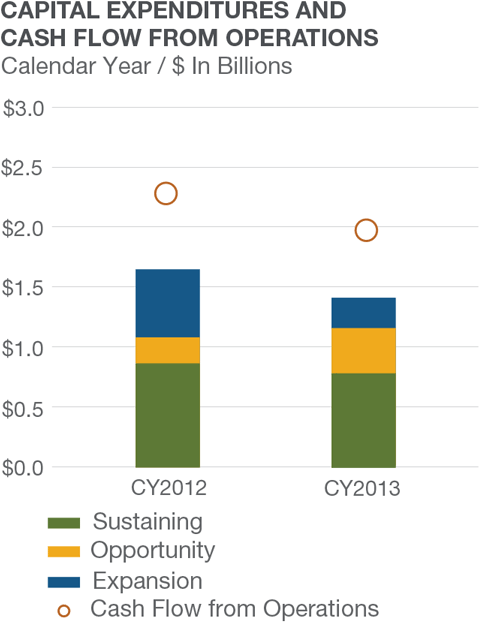
- Net Cash Provided by Operating Activities
- 2,269.9
- 2,019.9
- Capital Expenditures
- 1,674.7
- 1,426.6
- Dividends Per Share on Common Stock
- 0.68
- 1.00
Printable PDF
2013 Annual Report 10K