Notes
- Total Shareholder Return: The change in value over the period stated with all dividends reinvested. Total Shareholder Return is sometimes presented as the compound annual growth rate. The Total Shareholder Return for each year within the timeframe presented may vary.
- NAV per Share Growth: The estimated compound annual growth rate of Net Asset Value (NAV) per Share as estimated by Green Street Advisors, Inc. during the periods indicated. NAV per Share Growth for each year within the timeframe presented may vary.
- Redevelopment investment is shown excluding dollars invested prior to start of redevelopment.
Table Of Contents |
Form 10-K |
| Page Market for Registrant’s Common Equity, Related Stockholder Matters and Issuer Purchases of Equity Securities | 46 |
| Selected Financial Data | 47 |
| Management’s Discussion and Analysis of Financial Condition and Results of Operations | 50 |
| Quantitative and Qualitative Disclosures About Market Risk | 75 |
| Changes in and Disagreements with Accountants on Accounting and Financial Disclosure | 76 |
| Consolidated Financial Statements | F-3 |
Definitions And Reconciliations Of Non-GAAP Financial Measures And Other Terms
This Annual Report contains certain non-GAAP financial measures and other terms. The definition and calculation of these non-GAAP financial measures and other terms may differ from the definitions and methodologies used by other REITs and, accordingly, may not be comparable. The non-GAAP financial measures referred to below should not be considered an alternative to net income as an indication of our performance. In addition, these non-GAAP financial measures do not represent cash generated from operating activities in accordance with GAAP and therefore should not be considered as an alternative measure of liquidity or as indicative of cash available to fund cash needs. The definitions of non-GAAP financial measures and other terms not included below (Funds from Operations, Net Operating Income, Established/Same Store Communities) are contained in our Annual Report on Form 10-K which is distributed with and a part of this Annual Report.
The Multifamily Sector Average is a weighted average based on Total Market Capitalization per SNL Financial. The weighted average for “Total Shareholder Return”, “FFO” and “Long-Term Dividend Growth” includes AIV, BRE, CPT, EQR, ESS, HME, and UDR. The weighted average for “NAV per Share Growth” includes all companies under Green Street Advisors, Inc.’s coverage for which data is available during each of the time periods presented and includes AEC, BRE, CPT, EQR, PPS and UDR.
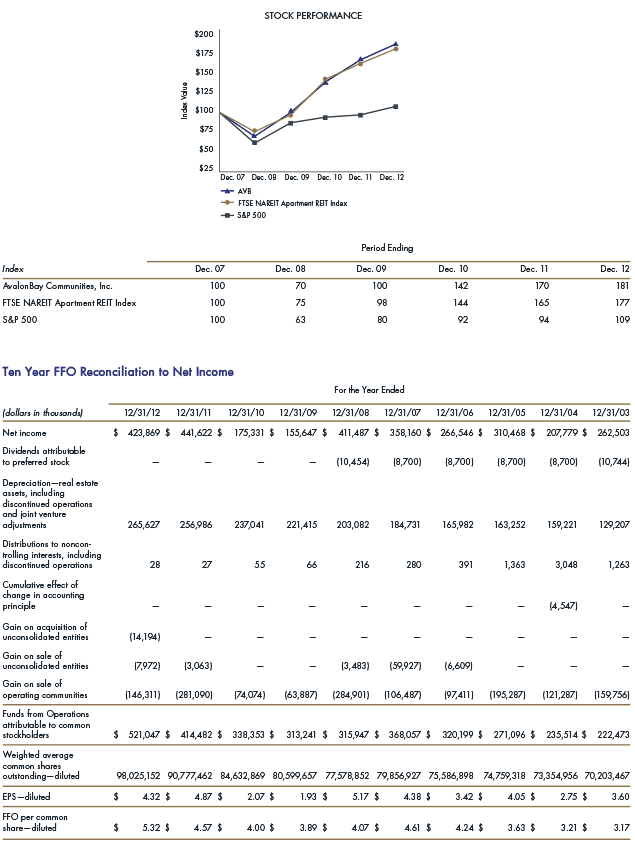
The Stock Performance Graph provides a comparison, from December 2007 through December 2012, of the cumulative total shareholder return (assuming reinvestment of dividends) among the Company, the Standard & Poor’s 500 Index, and a peer group index (the FTSE NAREIT Apartment REIT Index) composed of 15 publicly-traded apartment REITs, including the Company based on an initial purchase price of $100. The FTSE NAREIT Apartment REIT Index includes only REITs that invest directly or indirectly primarily in the equity ownership of multifamily residential apartment communities. Upon written request to the Company’s Secretary, the Company will provide any stockholder with a list of REITs included in the FTSE NAREIT Apartment REIT Index. The historical information set forth below is not necessarily indicative of future performance. Data for the FTSE NAREIT Apartment REIT Index and the S&P 500 Index were provided to the Company by NAREIT.