
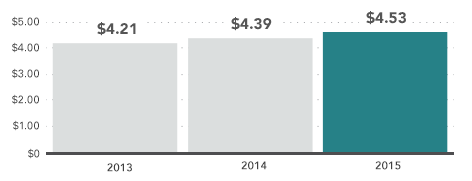
Record net income per share was achieved in 2015, reflecting steady and consistent growth from our subsidiary, Farm Bureau Life.
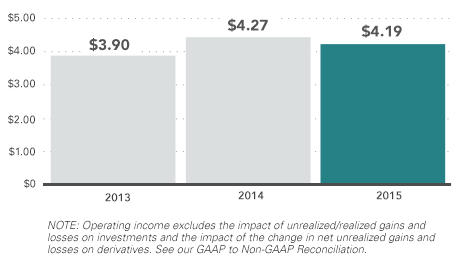
Operating income of $105 million, or $4.19 per share, was achieved in 2015 reflecting a disciplined approach to growing our business, active management of spreads and expenses, higher fee income, partially offset by increased death benefits.
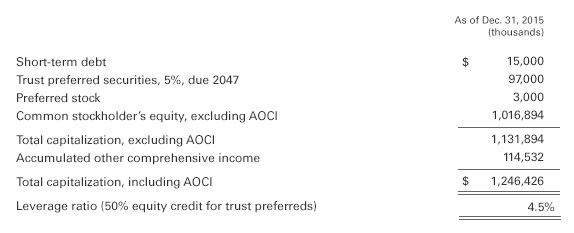
FBL Financial Group's total capitalization is $1.2 billion. Farm Bureau Life consistently generates excess capital, and FBL Financial Group's total excess capital is estimated to be $225 million at year end 2015.
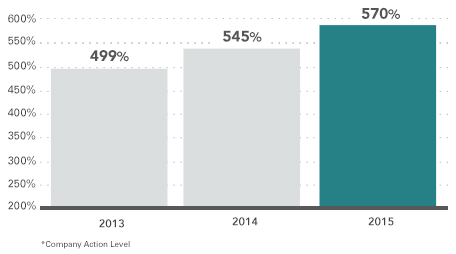
Farm Bureau Life's capital position remains very strong. The company action level risk based capital, or RBC*, ended 2015 at 570%. The increase in 2015 reflects strong earnings growth partially offset by $50 million in dividends paid from Farm Bureau Life to the parent company.
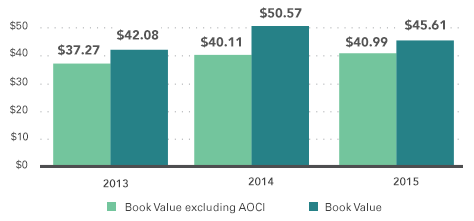
FBL Financial Group's book value per common share in 2015 was $45.61. Excluding accumulated other comprehensive income, book value per share grew by 2.2%. The growth in book value during 2015 was impacted by the payment of a $2.00 per share special dividend and $1.60 per share in regular dividends during the year. See our GAAP to Non-GAAP Reconciliation.
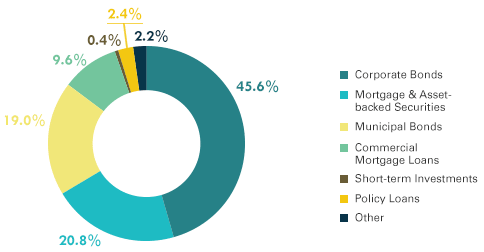
At December 31, 2015, FBL Financial Group's investments totaled $7.7 billion and are well diversified by individual issue and industry.
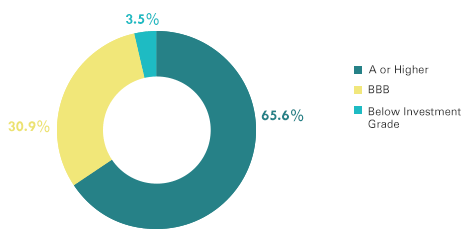
FBL Financial Group's investment portfolio quality is high with 96.5% of the fixed maturity securities being investment grade.